

Metrics 101 - LTV/CAC
A series of quick lessons on common financial metrics for SaaS, Tech and other businesses.

Part two of the series! Today we’ll discuss Lifetime Value (LTV), Customer Acquisition Cost (CAC) and the LTV/CAC Ratio.
Starting with a poll.
Lifetime Value (LTV)?
LTV represents the marginal earnings from each customer relationship over the expected tenure with the company.
Customer Acquisition Cost (CAC)?
CAC is the sales and marketing spend divided by new customers acquired.
Why is LTV/CAC important?
LTV/CAC is a metric of efficiency, providing a gauge of how well sales and marketing channels are leveraged to produce profitable customer relationships. Strong LTV/CAC indicates durability of the business and potential for continued success.
Beware of a low LTV/CAC ratio. Less than 1.0 indicates trouble. Either costs to acquire exceed incremental value of customer relationships, or the product is not being sufficiently monetized.
A healthy ratio is around 3.0, meaning earning $3 per $1 spent to acquire. That’s 67%. While LTV/CAC is not gross margin, 67%+ is where many SaaS businesses target all their margins.
Too much of a good thing? A ratio too high, say 5.0+ indicates a lot of value generation from customer relationships. However, management might consider spending to acquire further customers and drive growth. If the high ratio is due to low CAC, it may indicate conservative spend from lack of demand in the market.
How to calculate each and the LTV/CAC Ratio:
LTV/CAC =
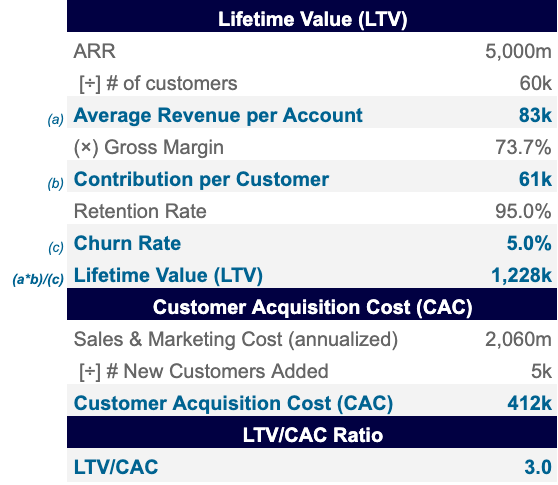
LTV = (Average Revenue per Account * Gross Margin %) / Churn Rate
Average Revenue per Account = recurring revenue / number of accounts
Gross Margin % = gross profit / revenue
Churn Rate = % of customer attrition over each period (i.e. 1 yr)
Bonus —> Retention Rate = 1 - Churn Rate
CAC = Sales & Marketing Expenses / # New Customers Acquired
Sales & Marketing (S&M) Expenses - costs include sales team compensation, marketing team compensation, and any advertising costs (i.e. search engine optimization, ad purchases, events, sponsorships, etc.)
# New Customers Acquired - reflect only new customers added during the period; these are the conversions attributed to the S&M motion
LTV/CAC Example
Let’s attempt an example, a (fictional) SaaS provider with $5B in ARR, 60 thousand customers, churn of 5%, $2.9B in S&M spending and 5 thousand new customers.

This company’s LTV/CAC ratio is 2.1. While 2.1 is exceeding areas of concern around the 1.0, this company is short of a more desirable 3.0 ratio measurement.
Strategy application: LTV/CAC
Let’s discuss how changes in the business can impact and improve LTV/CAC:
Improve retention rate (i.e. reduce churn) - An improvement of 1% to customer retention increases LTV/CAC by 6pts to 2.7. In this scenario, the company is realizing approximately $300k per customer more over their lifetime.

Grow ARR - Increasing the ARR of the business would lift the LTV/CAC ratio. All businesses want to expand revenue. Depending on market and customer dynamics, this is not always easy. A product providing customers a solution they cannot live without makes revenue expansion easier.

Optimize Sales & Marketing Spend - A company can constrain/optimize overall cost of S&M organizations, or focus on only the highest ROI S&M methods, while foregoing others. While only a hypothetical example, spend control in S&M yields the highest ratio, an optimal 3.0.
I hope that these scenarios are thought provoking. Keep in mind, each of these levers would have various trade-offs and levels of optimal deployment. Finding the balance is entirely company, customer and product dependent.
Conclusions
LTV/CAC encapsulates many pieces of a company’s performance picture, revenue, customer retention and go-to-market capabilities. This ratio gives insight into management’s control and efficiency in delivering revenue. LTV/CAC can also guide decision making, setting hurdle rates for project assessment, refine product focus and optimize spending. LTV/CAC prevents a business from mistaking “all growth” as good growth, and rewards balanced growth… a better position for sustained success.
Thanks for reading.
- GB
Further reading, check out this great source.1
Disclosures: Calculations and examples have been simplified for example and learning applicability. Assess your own specific use cases with real data accordingly. Refer to footnotes below for further reading.